|
|||||||
 |
|||||||
Dear Experimenter, To open another avenue of communication with fellow DOE and Stat-Ease fans, sign up for The Stat-Ease Professional Network on LinkedIn. |
![]()
Topics in the body text of this DOE FAQ Alert are headlined below (the "Expert" ones, if any, delve into statistical details):
| 1: | FAQ: How version 10 of Stat-Ease software makes it easier than ever for experimenters to pick out vital factorial effects at a glance | ||
| 2: | Video alert: Premiering on “Statistics Made Easy by Stat-Ease” YouTube Channel: “Stat-Ease mini-Tips”—a terrific software feature demonstrated in about 1 minute | ||
| 3: | Webinar alert: Graphical Selection of Factorial Effects—What’s In It for You | ||
| 4: | Software alert: Version 10.0.4 of Design-Expert® software released (free update for licensed users of v10) | ||
| 5: | Events alert: Must-see “Smart Data: Design of Experiments” session coming to D.C. area | ||
| 6: | Workshop alert: See when and where to learn about DOE—Sign up now before classes fill | ||
P.S. Quote for the month: Astrophysicist’s epiphany on statistical methods—the only way to link data to what needs to be understood.
(Page down to the end of this e-zine to enjoy the actual quote.)
![]()
1: FAQ: How version 10 of Stat-Ease software makes it easier than ever for experimenters to pick out vital factorial effects at a glance
Original Question from an Industrial Statistician:
“In version 9 of Design-Expert® software and Design-Ease® software the line through presumably trivial effects shifts when you select the vital few. It doesn’t appear to do so in DX10. What changed and why?”
Answer from Stat-Ease Consultant Shari Kraber:
“In DX9 the line started by fitting 100% of the points. Then it adjusted to the remaining unselected effects as users picked them off one by one. To make it easier to see any separation between the trivial many and the vital few, DX10 presets the line to the smallest 50% of the effects.* Then, as before, you select effects, but now it becomes much easier to identify those that fall off the line. Version 10 still refits the line if users choose effects below the 50th percentile. There is a preference to change back to the DX9 way (line fitting effects through 100th percentile) under Edit Preferences>Graphs>Effects Graph.”
See this video for a dynamic demonstration of selecting effects using the half-normal plot (software default). We implemented the new, 50%-preselect approach of v10 after seeing it suggested by Doug Montgomery in his rebuttal to “The Case Against Normal Plots of Effects” by Russell Lenth (Journal of Quality Technology, Vol. 47, No. 2, April 2015, Discussion 3, pp 105-106. See it at work below on the popcorn case from DOE Simplified, 3rd Edition.
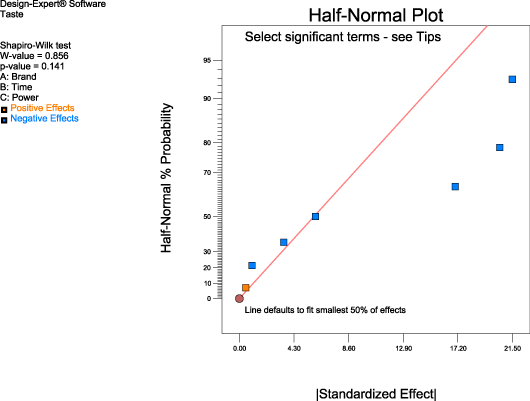
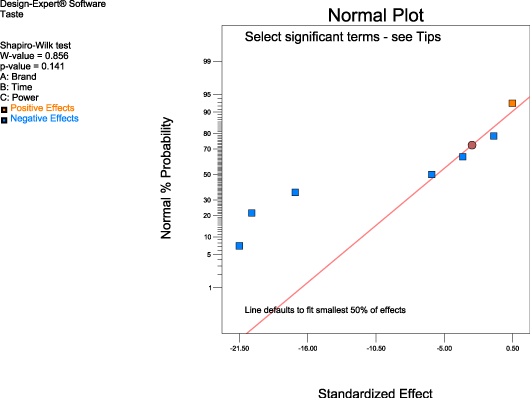
Half-normal (above) and full-normal (below) plots of effects with line pre-set by v10 for ease of selection
—Mark
2: Video alert: Premiering on “Statistics Made Easy by Stat-Ease” YouTube Channel: “Stat-Ease mini-Tips”—a terrific software feature demonstrated in about 1 minute
Please spare a minute or so from your busy schedule to check out my video demo of our graphical selection tools for factorial effects which I posted at the “Statistics Made Easy by Stat-Ease” YouTube Channel. This is the first in an ongoing series of “mini-Tips” that will be produced by Stat-Ease. I hope you like it!
![]()
3: Webinar alert: Graphical Selection of Factorial Effects—What’s In It for You
Via two world-wide webinars, I will provide insights into graphical approaches—half-normal and Pareto plots—that assess effects at a glance—a huge advantage for experimenters who get overwhelmed by esoteric statistical reports. My presentation details an impressive number of software enhancements incorporated that:
- deploy these graphical tools over a broad array of factorial designs (including multilevel categoric and split plot),
- make them more robust to missing data and non-orthogonal levels, and
- provide interactive layouts that lead to good decisions on sorting out the vital few effects from the trivial many.
Via a variety of case studies I will demonstrate how we make effect selection easy for our users.
I hope you will join me for my talk on “Graphical Selection of Factorial Effects—What’s In It for You”. Reserve your GotoWebinar seat now at by clicking on one of the links below:
If this is your first Stat-Ease webinar, please review these suggestions on how to be prepared. If questions remain, direct them to our Client Specialist, Rachel Pollack, via workshops@statease.com.
*(To determine the time in your zone of the world, try using this link. We are based in Minneapolis, which appears on the city list that you must manipulate to calculate the time correctly.)
![]()
4: Software alert: Version 10.0.4 of Design-Expert software released (free update for licensed users of v10)
Newly-released version 10.0.4 of Design-Expert software is posted at this download site for free trial evaluation. To update older licensed versions of 10.0, simply download the update from within the program, or download the full installation and reinstall it. The release primarily provides maintenance of existing features. View the Read Me file for details on this update, installation tips, known ‘bugs,’ change history, and FAQs.
P.S. Reminder: If you want to be notified when an update becomes available, go to Edit on the main menu of your program, select Preferences and, within the default General tab, turn on (if not already on by default) the “Check for updates on program start” option.5: Events alert: Must-see “Smart Data: Design of Experiments” session coming to D.C. area
I will co-chair a session on “Smart Data: Design of Experiments” and, there, give a talk on “Ruggedness Testing Made Easier with Graphical Effects Analysis” for IFPAC 2017 in Arlington, VA, (Washington, D.C.) February 27 - March 3. This conference gathers technical professionals seeking tools for process analytical technology (PAT), quality by design (QbD), and real-time analytics. Register for IFPAC 2017 here.
Click here for this and other upcoming appearances by Stat-Ease professionals.
6: Workshop alert: See when and where to learn about DOE—Sign up now before classes fill
You can do no better for quickly advancing your DOE skills than attending a Stat-Ease workshop. In these computer-intensive classes, our expert instructors provide you with a lively and extremely informative series of lectures interspersed by valuable hands-on exercises with one-on-one coaching. Enroll at least 6 weeks prior to the date so your place can be assured—plus get a 10% “early-bird” discount.
- DOE Simplified: Half-Day Workshop (DOESH)
*New! This dynamic half-day workshop will open your eyes to the power of design of experiments and demonstrate the tools you need to achieve breakthrough improvements in your processes and create superior products. - January 18, Minneapolis, Minnesota (MN)
- Experiment Design Made Easy (EDME)
- April 3-4, San Jose, California (CA)
- Modern DOE for Process Optimization (MDOE)*
*New! In one three-day class, master the entire strategy of experimentation from screening, characterization to optimization using factorial designs and response surface methods (RSM). - January 31 – February 2, Minneapolis, Minnesota (MN)
- Mixture and Combined Designs for Optimal Formulations (MIXC)
- February 22-24, Minneapolis, Minnesota (MN)
- Designed Experiments for Pharma (DEPH)
- May 15-16, Edison, New Jersey (NJ)
See this web page for complete schedule and site information on all Stat-Ease workshops open to the public. To enroll, scroll down to the workshop of your choice and click on it, or call our Client Specialist Rachel Pollack, at 612-746-2030. If spots remain available, bring along several colleagues and take advantage of quantity discounts in tuition. Or, consider bringing in an expert from Stat-Ease to teach a private class at your site.*
*Once you achieve a critical mass of about 6 students, it becomes very economical to sponsor a private workshop, which is most convenient and effective for your staff. For a quote, e-mail workshops@statease.com.
I hope you learned something from this issue. Address your general questions and comments to me at: mark@statease.com.
Please do not send me requests to subscribe or unsubscribe—follow the instructions at the end of this message.
Sincerely,
Mark
Mark J. Anderson, PE, CQE
Principal, Stat-Ease, Inc.
2021 East Hennepin Avenue, Suite 480
Minneapolis, Minnesota 55413 USA
P.S. Quote for the month—Astrophysicist’s epiphany on statistical methods—the only way to link data to what needs to be understood:
"There is only one way to make clear links between the data you have taken and what the world wants to understand. You have to be very clear and very clever about interrogating the data. You have to develop methods—statistical methods—that extract answers you can trust.”
—Adam Frank, Astrophysics Professor at the University of Rochester, excerpted from November 22, 2016, NPR Commentary “How I Learned To Love Statistics—And Why You Should, Too”
Trademarks: Stat-Ease, Design-Ease, Design-Expert and Statistics Made Easy are registered trademarks of Stat-Ease, Inc.
Acknowledgements to contributors:
—Students of Stat-Ease training and users of Stat-Ease software
—Stat-Ease consultants Pat Whitcomb, Shari Kraber, Wayne Adams, and Martin Bezener
—Statistical advisor to Stat-Ease: Dr. Gary Oehlert
—Stat-Ease programmers led by Neal Vaughn
—Heidi Hansel Wolfe, Stat-Ease sales and marketing director,
and all the remaining staff that provide such supreme support!
![]() For breaking news from Stat-Ease go to our Twitter feed.
For breaking news from Stat-Ease go to our Twitter feed.
DOE FAQ Alert ©2016 Stat-Ease, Inc.
Circulation: Over 6000 worldwide
All rights reserved.