
Don’t Waste Existing Data: Import it and Mine for Gold
Existing data can yield valuable insights for immediate process or product improvement or point you in the right direction for a well-planned experiment. Here’s how to get that “happenstance” data into Stat-Ease software in a few clicks and put its powerful modeling, graphing and optimization tools to good use.
Original question from a pharmaceutics professor:
“I am trying to make the most from existing data on a sustained-release formulation based on happenstance inputs. We have all the corresponding responses. How can I import this data into your software?“
Answer from Stat-Ease:
Design-Expert® software (DX) provides handy and intuitive import tools to paste in existing data copied to the Windows clipboard, ideally from Excel. Stat-Ease® 360 (SE360) software offers additional capability to read Excel files for direct import. This tool can be accessed from the main screen.
I will now demonstrate importing via pasting data from your clipboard, doable with either DX or SE360.
Begin by copying data on all your inputs—process factors and/or mixture components—and outputs (the responses), including the names and units of measure, to the clipboard.
Next open your Stat-Ease software, click IMPORT DATA and then Paste from Clipboard as shown in Figure 1.
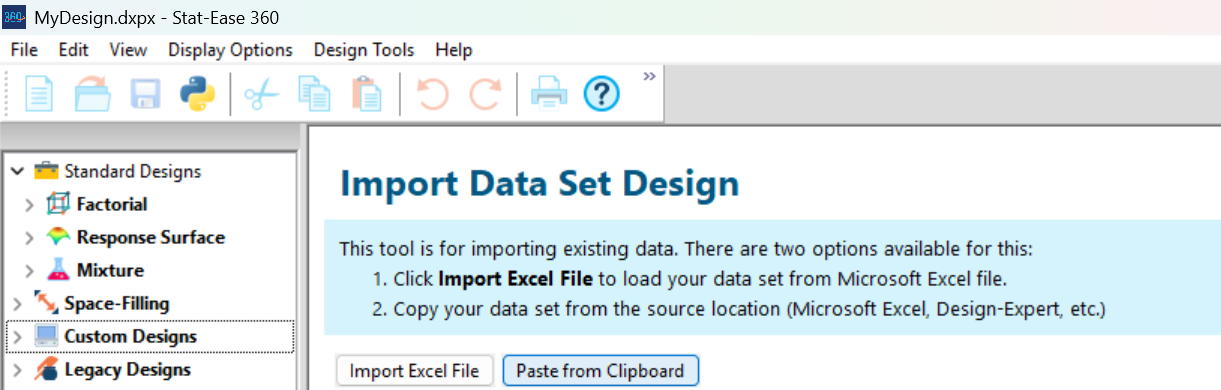
Figure 1: Preparing to paste in existing data
Then, via right clicks on rows and columns, identify or delete them. You will find this process to be very easy and intuitive.
For example, I imported a dataset from the U.S. Bureau of Labor Statistics that James Longley used to test regression software.* Next, as displayed in Figure 2, I began the process of identification by right clicking to the left of row 1 and making it the factor names.
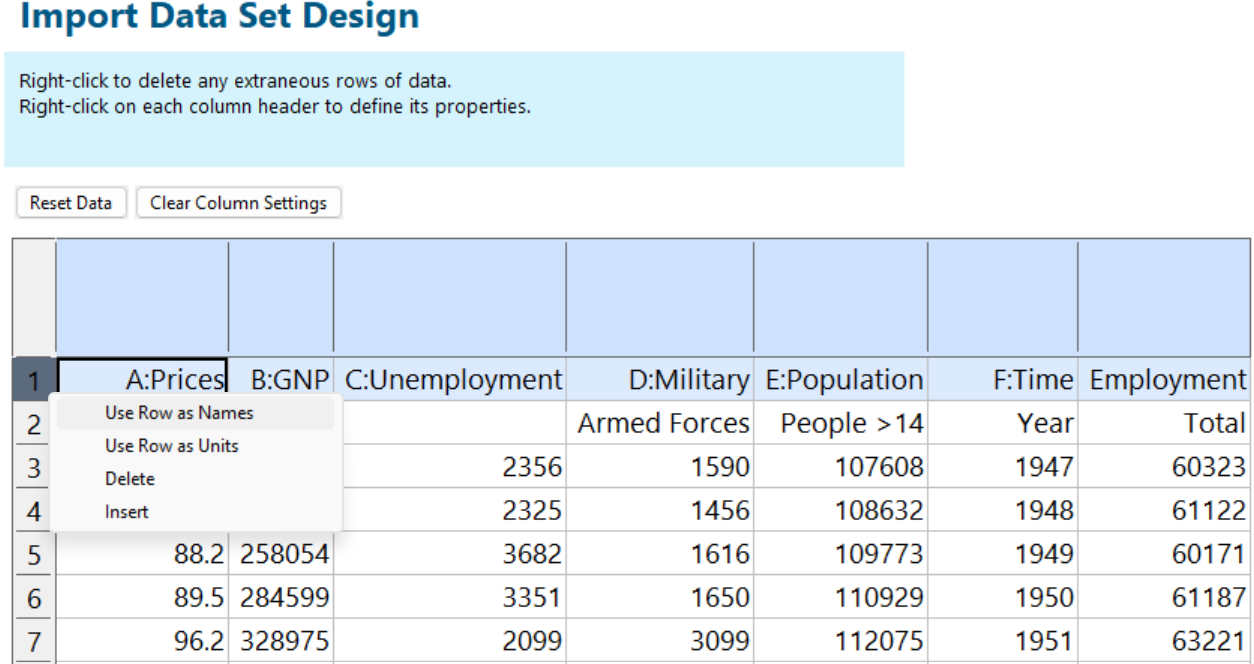
Figure 2: Identifying the first row of pasted-in Longley data as the factor names
After identifying the second row as units, I right clicked on the first column and set it as a numeric factor as shown in Figure 3.
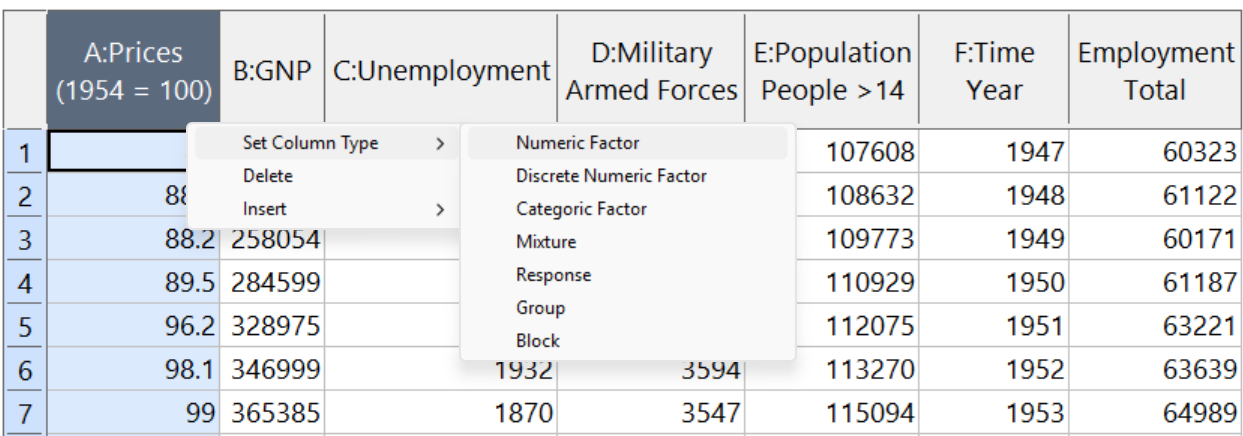
Figure 3: Identifying the first column as a numeric factor
From there I identified the other factors and the response. When all rows and columns were identified, I pressed Finish.
Stat-Ease software provides many helpful guard rails and niceties throughout the entire process of importing data and helping you model it. For example, if you forget to identify a row or column, the software will pop up an error. Also, it provides special treatment to inputs identified as mixture components—ensuring that they always add to a fixed total. After accomplishing the import, Stat-Ease software sets up the appropriate analysis—factorial, process response surface, mixture or combined mixture-process.
For a video demo of the process to import the Longley data, view my presentation on Evaluating and Exploiting Existing Data (gold or garbage?). As you will see, it is very easy to do. The video shows how Stat-Ease software’s powerful tools can then be deployed to mine the most from your existing data, making it easy to deploy regression tools to derive predictive models, generate compelling 3D and other graphics and search out desirable settings for the factors and/or components.
*“An Appraisal of Least Squares Programs for the Electronic Computer from the Point of View of the User,” Journal of the American Statistical Association, 62 (1967): 819-841.