Stat-Teaser September 2017

September 2017
In this issue:
1. Mixture Designs—What Good Are They Anyway? by Shari Kraber
2. Stat-Ease Trainer Spotlight: Reed Wahlberg
3. Get Up-to-Speed on DOE with Our Instructor-Led Workshops
4. Stat-Ease Webinar Alert: Formulation Simplified: Finding the Sweet Spot via Design and Analysis of Experiments with Mixtures
5. Strategies for Mixture DOE Space Augmentation by Martin Bezener
6. Call for Speakers for the 7th European DOE User Meeting in Paris, France!
Mixture Designs—What Good Are They Anyway?
Two-level factorial designs and response surface designs are generally the “go-to” DOE choice for solving problems. They are effective tools for identifying the relationships between independent process factors. Discussion comes about when the variables are components of a mixture. What type of design is useful when these variables are no longer independent, but their proportions relative to each other and to the total product, are important? Mixture designs are specially formulated to account for these dependencies.
What makes a mixture?
- The factors are ingredients of a mixture.
- The response is a function of proportions, not amounts.
"Given these two conditions, fixing the total (an equality constraint) facilitates modeling of the response as a function of component proportions.”
—Pat Whitcomb, Stat-Ease Founder
Pat suggests that formulators ask themselves an easy question: “If I double everything, will I get a different result?” If the answer is no, such as it would be for a sip of sangria from a glass versus a carafe, for example (strictly for the purpose of tasting!), then mixture design will be the best approach to experimentation.
Why doesn’t factorial design work for mixtures? Consider this scenario: we are going to set up a lemonade stand and run a factorial design on the amount of lemon juice and the amount of sugar water. If a two-level factorial design is used, then one factor is the amount of lemon juice—1 lemon or 2 lemons. The second factor is the amount of sugar/water—1 cup or 2 cups. The response will be the taste.

Taste corner #1 (1 lemon + 1 cup sugar water). Cool and refreshing.
Taste corner #2 (1 lemons + 2 cups sugar water). It has a weaker lemon flavor.
Taste corner #3 (2 lemons + 1 cup sugar water). It has a stronger lemon flavor.
Taste corner #4 (2 lemons + 2 cups sugar water). This is the interaction corner, where great things happen in factorial designs! In this case, the product in corner #4 is identical to corner #1, but there is twice as much volume!
This illustration highlights the primary difference with mixture designs—
the response is a function of the proportions of the components. There is a built-in dependency in the system that completely foils the standard two-level factorial and response surface designs. Mixture designs take into account the dependency between the components by using triangular (simplex) designs, and special polynomials called Scheffe’ polynomials. More details on these special polynomials can be found in
A Primer on Mixture Design: What’s In It for Formulators? by Mark Anderson, Principal of Stat-Ease. It establishes the WIIFM (what’s in it for me) that will encourage formulators to work through the heavier aspects of mixture design, response modeling, statistical analysis and numerical optimization.
Mark and his co-authors Pat Whitcomb and Martin Bezener are working on a new book entitled
Formulation Simplified. This follow-up to the
DOE Simplilfied and
RSM Simplified books will show formulators how to handle many ingredients simultaneously—not just one factor at a time (OFAT). They will learn how to take advantage of the modern-day parallel processing schemes of mixture designs that provide multicomponent testing. Look for this book later in 2018.
Why don’t scientists use mixture designs?
Argument: I want to use an orthogonal design.
Answer: Think of the lemonade example: The factors (sugar water and lemon juice) aren’t orthogonal; unidentified linear combinations of them are. Collinearity is hidden rather than addressed when mixture components are put into a process design.
Argument: Mixtures experiments are too large.
Answer: Not true. A mixture polynomial has the same number of coefficients as an ordinary polynomial with one less factor. This means the exact same number of runs are needed to fit the mixture component model and the RSM ratio model. If the mixture components are put directly into a process design it is bigger than the mixture.
Argument: Mixture models are hard to understand.
Answer: Think again of the lemonade example, the coefficients in the model are misleading because they are on unidentified linear combinations of the components. Besides, with modern computer software we look at graphs and use numeric and graphic optimization to understand DOE results. We don’t look to the models for interpretation.
Want to learn more about mixture designs? Mark Anderson will be presenting a webinar on Formulation Simplified: Finding the Sweet Spot via Design and Analysis of Experiments with Mixtures three times live this October 10–12. Learn more on our Webinars page and register here. Subscribe to Mark's fun and informative DOE FAQ Alert newsletter for alerts to future webinars. Go to our Webinars page to view recordings of past presentations.
—by Shari Kraber, shari@statease.com
↑Go back to the top
Stat-Ease Trainer Spotlight: Reed Wahlberg

Reed Wahlberg
We are proud to introduce Stat-Ease trainer, Reed Wahlberg. Reed has worked with Stat-Ease in the past, and recently rejoined the team. After earning his Masters in Business Administration with a concentration in Management Information Systems and Quality Management from the University of Minnesota, Reed worked for 10 years in software engineering at United HealthCare and WebMD. He then launched his own consulting company and helped a number of Twin Cities companies with their Six Sigma projects to improve performance. Reed also worked for a number of years as a quality engineer at Boston Scientific, ensuring that a wide variety of medical devices continued to meet customer needs and FDA requirements. He is a certified ASQ Quality Engineer and a Six Sigma black belt.
Some fun facts about Reed:
- When teaching DOE, he tries to spice up his classes with a daily review of key concepts via JeoparDOE—a fun quiz patterned after the USA television game show.
- He and his wife just returned from their 2nd annual bicycle tour of France this month.
- His hobbies include Pickleball (America's fastest growing sport), learning to play Bridge, and restoring native plants and wild flowers in the woods in his backyard.
- He took a course last fall to become a Hennepin County Master Recycler.
If you get the chance to meet Reed in the course of training, please wish him a warm welcome. Learn more about Stat-Ease training, including public workshops, on-site classes, and e-learning through the Stat-Ease Academy, by clicking here.
↑Go back to the top
Get Up-to-Speed on DOE with Our Instructor-Led Workshops

Learn how you can make breakthroughs that lead to success with Stat-Ease design of experiments (DOE) workshops. Whether you are just starting out with DOE or are a practiced experimenter, we have a workshop* for you. Our computer-intensive classes include hands-on exercises and one-on-one coaching by experienced instructors. Enroll at least 6 weeks prior to the date to assure your seat—plus get a 10% “early-bird” discount. Find a list of our upcoming public workshops below:
See this web page for complete schedule and site information on all Stat-Ease workshops open to the public. Dates and locations for 2018 will be posted soon! To enroll, scroll down to the workshop of your choice and click on it, e-mail workshops@statease.com, or call our Client Specialist, Rachel Pollack, at 612-746-2030. If spots remain available, bring along several colleagues and take advantage of quantity discounts in tuition. Or, consider bringing in an expert from Stat-Ease to teach a private class at your site. Industry-specific classes are available. This is a cost-effective and convenient option if you have 6 or more people to train. For more information on private workshops, click here.
To view our e-learning options, see the Stat-Ease Academy. At your own pace, master the basics of statistics and how to apply DOE to maximum advantage. No traveling necessary! Some courses are available free of charge, while others can be purchased for a small fee.
*Workshops are limited to 16 participants. Receive a $200 quantity discount per class when you enroll 2 or more students, or when a single student enrolls in multiple workshops. For more information, contact Rachel via e-mail or at at 612.746.2030.
↑Go back to the top
Stat-Ease Webinar Alert: Formulation Simplified: Finding the Sweet Spot via Design and Analysis of Experiments with Mixtures
 Consultant Mark Anderson
Tuesday, October 10, 2017 at 6:30 am - 7:30 am CDT* (for Europe, Africa, India, the Middle East and western Asia, others welcome!)
Wednesday, October 11, 2017 at 7:00 pm – 8:00 pm CDT* (for Australia, NZ and eastern Asia, others welcome!)
Thursday, October 12, 2017 at 11:00 am - 12:00 pm CDT* (for the Americas and Caribbean, others welcome!)
Via three world-wide webinars during the second week of October (see times above), Mark will introduce tools for multi-component product development and optimization in this beginner-level presentation. He will brief formulators on tailored tools that hone in on optimal recipes. The webinar begins with a compelling case on the mismatch of factorial design and response surface methods to mixture DOE. Then, via real-world examples, he will lay out more appropriate designs and models for mixtures that ultimately lead to the “sweet spot”—a formulation meeting all product specifications.
↑Go back to the top
Strategies for Mixture DOE Space Augmentation
What’s the Problem?
One of the first, and most important, steps in any mixture experiment is the proper selection of the mixture components and their lows and highs. These are typically selected based on subject-matter knowledge, previous experimental data, and the goals of the experiment. The component lower and upper bounds define the DOE space—that is, all (theoretically) possible mixtures that can be tested in the experiment. Of course, only certain mixtures in the DOE space will be selected and performed during the experiment.
This is not an easy task. In some situations, very little prior information is available or the problem is completely new. A general guideline for selecting the DOE space is that the target optimum be contained somewhere in the center of the space—easier said than done before seeing any data!
Let’s suppose we run a simple three-component experiment, labelling the components as X1, X2, and X3. In a perfect world, after experimentation and optimization, we would hope to see something like in Figure 1.
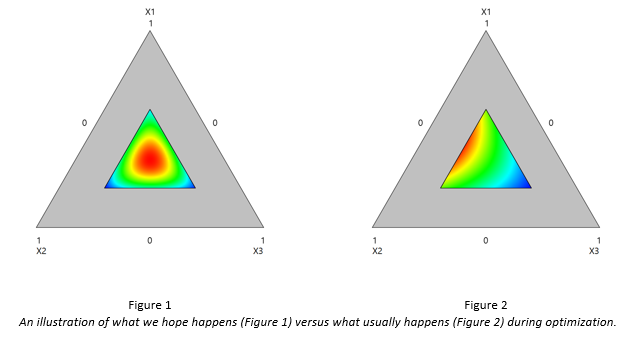
Notice that the red optimum lies neatly in the middle of the DOE space. If confirmation runs validate this optimum, we would be happy as we’ve likely fully optimized our process, and have a large operating window for production.
But what usually happens is something like in Figure 2. This is disappointing for several reasons. First, we don’t know where the true optimum is. It may be near the boundary, or much further out. It’s obvious we could have done better if we had chosen higher upper bounds for components X1 and X2. Also, there’s not much of an operating window, and the solution is probably not robust. Before we get too worried, it may be that the optimum on the boundary is “good enough”, in which case we could probably stop. But if the result falls short of our expectations, then we will need to continue experimentation.
Unfortunately, many experimenters fall into the trap of thinking that an entirely new experiment must be performed, and that all the data collected from the first experiment must be discarded. However, this is not always the case! In some situations, it may be possible to expand, or augment, the DOE space, filling the new space with some additional runs and performing a follow-up experiment. Other experimenters will attempt to extrapolate outside of the original space, which is usually not recommended. Let’s look at a simple illustration to see what’s going on.
A Simple Illustration
Suppose we have a three-component experiment. For the sake of brevity and to keep the focus on DOE, we’ll label the ingredients A, B, C, which sum to 1.0 and have the following ranges:
0.1 ≤ A ≤ 0.5
0.3 ≤ B ≤ 0.7
0.2 ≤ C ≤ 0.5
A 12-run I-optimal design was built, which is displayed in Figure 3. The DOE space, as a portion of the entire mixture simplex, is colored in white. Three runs were replicated to provide an estimate of the pure error.
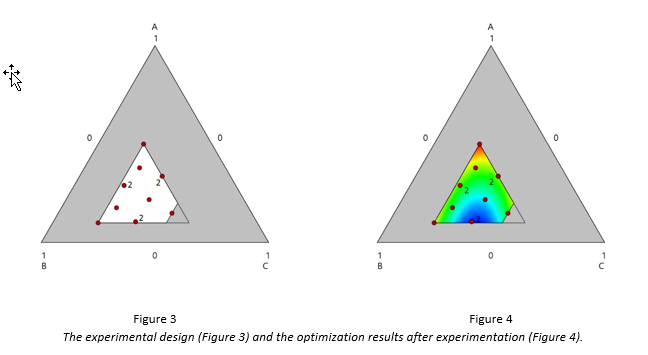
The goal of the experiment was to determine the blend of A, B, and C that would maximize the measured response. After the experiment was performed, optimization showed that the maximum response is predicted to occur at the blend A=0.5, B=0.3, C=0.2, which is a vertex. The optimization results are displayed in Figure 4.
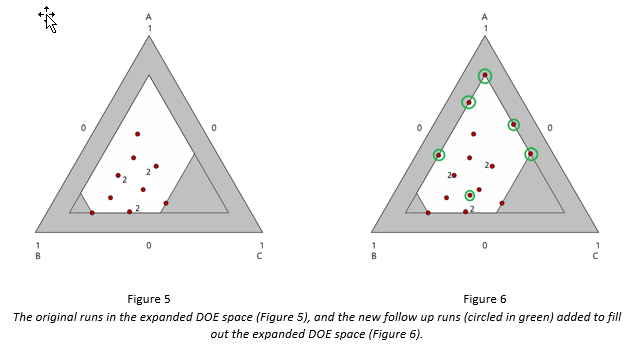
The experimenters were obviously disappointed, as they fell somewhat short of their target, and had a very narrow operating window to work with—basically the vertex. Instead of re-doing the entire experiment, they expanded the DOE space by raising the upper bound of component A to 0.8, and lowering the bounds of B and C both to 0.1:
0.1 ≤ A ≤ 0.5 0.1 ≤ A ≤ 0.8
0.3 ≤ B ≤ 0.7 0.1 ≤ B ≤ 0.7
0.2 ≤ C ≤ 0.5 0.1 ≤ C ≤ 0.5
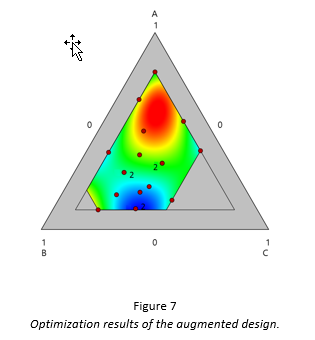
The original runs were retained. The expanded DOE space is displayed in Figure 5, which also includes the runs of the original design. Afterwards, the design was augmented I-optimally to include 5 model points and 1 lack-of-fit point to ensure no large gaps between runs. This design is displayed in Figure 6. The 6 follow-up runs were added in a second block, which is why none of the 6 follow-up runs is contained in the original DOE space. After the 6 follow-up runs were performed, the optimization results are displayed in Figure 7. These results are much more satisfactory. The predicted response is approximately 10% higher than the response at the vertex—enough to bring their process within their target spec, and providing a large operating window for production.
Notice that with the addition of just 6 runs, the experimenters fully optimized the process, and have more information (18 runs worth), compared to discarding their data and doing a brand new 12-run experiment.
Wrap Up
The major point of this article is to make you aware of the idea of DOE space augmentation. In some cases, you may save substantial time (and money!) by doing follow-up runs in an augmented space, rather than throwing away your data and performing a second full experiment.
This is not a flawless strategy, however, and there really isn’t a one-size-fits-all solution that is applicable to every problem. Here are a couple of concluding notes:
- This strategy only works if the DOE space can be expanded to “capture” the optimum. If you completely struck out on the original space, you may need to move to a region that’s disjoint from the original DOE space. In such cases, it may better to re-do the entire experiment.
- There still isn’t agreement as to how many additional runs should be performed in the follow-up experiment. A good rule of thumb is half of the runs in the original experiment.
- Although mixture experiments are the primary focus of this article, the same strategy can be applied to response surface experiments.
- You may need to augment more than once!
We’re constantly working on strategies to help you improve your experimentation. If this article was of interest to you, and you’d like to learn more about mixture experiments, consider enrolling in our 3-day mixture DOE workshop, Mixture and Combined Designs for Optimal Formulations, where the topic of DOE space augmentation is discussed in more detail. We hope you learned something, and please feel free to contact us with questions, suggestions, and other feedback.
↑Go back to the top
Call for Speakers for the 7th European DOE User Meeting & Workshops in Paris, France!

Are you interested in speaking at the 7th European DOE User Meeting & Workshops hosted by Stat-Ease, Inc. and our partner Ritme in Paris, France on June 6-8, 2018? You are invited to submit an abstract (up to 250 words) on your application of Design-Expert® software.
The DOE User Meeting will be held at Le CNAM (or the National Conservatory of Arts and Crafts) in the heart of Paris, close to the Louvre and Notre Dame. The conference will include optional pre-conference workshops on June 6, followed by the 2-day user meeting on June 7-8 with talks by DOE Experts and industry practitioners. There will also be a special evening event on the 7th. You won't want to miss this fun and educational conference in beautiful Paris!
Talk: 25 minutes (including questions)
Abstract: Up to 250 words
Deadline: February 15, 2018
Submit your Abstract here
Potential topics may include:
- A successful DOE that you did using Design-Expert or Design-Ease® software and what you learned from it. Did you make a breakthrough? Did it validate your process or reveal something unexpected?
- An unsuccessful DOE that you did using Design-Expert or Design-Ease software and what you learned from it. Did your experiment not go as planned? What would you do differently next time?
- A case study demonstrating a successful use of DOE and MVA together using CAMO's Unscrambler® X software with Design-Expert.
- How have you inspired the use of DOE in your organization?
- Any interesting use of Design-Expert software and DOE.
Speakers will receive reduced conference pricing. Look for more details to come in future notices. Contact Heidi Hansel Wolfe with any questions. Save the date and plan now to attend!
↑Go back to the top