Note
Screenshots may differ slightly depending on software version.
Poisson Regression
Introduction
Poisson regression provides an advanced tool for users of Stat-Ease® software who must contend with counts as a response from their experiment. When applied properly, Poisson regression produces models that predict results more accurately with greater precision than the usual ordinary least squares methods. This will be demonstrated by the tutorial case.
Counts often provide a good measure of process performance or product quality, for example the number of defects on a surface or colony forming units (CFU) in a cell culture. They are discrete whole numbers with no upper bound. In most cases, counts follow a non-normal Poisson distribution, thus, at the very least, require a response transformation—the standard option being a square root with natural log as an alternative. This transformation remedies issues such as negative predictions, bad models and spurious outliers. However, it satisfies only some normal assumptions and introduces retransformation bias. For further discussion on these issues, see Some Experiences in Modern Experimental Design, by Marcus B. Perry.
Poisson regression naturally resolves the issues that come with transformations. But other than assuming the errors follow a Poisson, not a normal, distribution, Poisson regression looks much like ordinary least squares (OLS) regression. Another difference from OLS is that Poisson regression fits the natural log of the response variable.
For more details on Poisson regression see Section 4.3 in Generalized Linear Models with Applications in Engineering and the Sciences, 2nd Ed., by, Myers, Montgomery, Vining & Robinson. Check out their aircraft damage case that regresses the number of locations hit by the United States Navy on Vietnam War missions against the type of aircraft, bomb load and crew experience.
Case Study: Antiseptic
This tutorial demonstrates the application of Poisson regression to optimize the formulation of a topical antiseptic. The data stem from a case taught in the Stat-Ease Mixture Design for Optimal Formulations workshop. The experiment required the application of an optimal design to fit the complex (non-simplex) component constraints. It measured efficacy by the count of colony-forming units (CFU)—the fewer the better.
Open the program and go to the Help menu, then hover over Tutorial Data and click Antiseptic to load your data. The file comes with the response already modeled in three alternative ways: as-is and transformed by square root versus the natural log (recommended by the Box-Cox diagnostic plot).
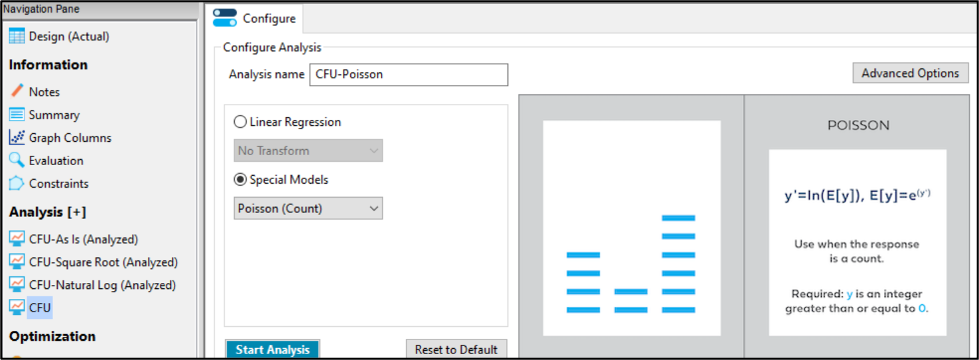
Click Analysis [+] and OK to begin the process of adding a new CFU analysis. Select Special Models. Recognizing the data being whole numbers, the program defaults to “Poisson (Count)”. To differentiate this model from the others most clearly, edit the Analysis Name by adding “-Poisson”.
Next, press the Start Analysis button. You now should see the usual series of left-to-right tabs for the progressive steps needed to select a model, test it statistically and generate response graphs.
Skip ahead to the ANOVA tab to see the model recommended—the optimally designed-for quadratic mixture order. The statistics all look very good, with low p-values and high R-squared values.

Feel free at this point to go to the Model tab and apply the Auto Select tool for term elimination. However, the full model will be hard to beat in this case.
Finish up this tour of Poisson regression for the antiseptic case by pressing the Model Graphs tab and viewing the 3D Surface.

Grab the Zinc slide bar at the right with your mouse. Then move it back and forth to generate dramatic changes in the CFU caused by this adding less or more of this powerful ingredient. Impressive!
Finally, to see the advantage of Poisson regression in this case, click the Point Prediction node and see how it produces far lower standard deviation (11.355) than the OLS models, which translates to a much tighter confidence interval at this centroid formulation (and elsewhere in the mixture space explored by this experiment).

Not only is the Poisson regression model more precise, it does so at a lesser order of polynomial—a quadratic, versus special cubic for the next best alternative—the natural log transformation. Click the Coefficients Table to see all four models compared top-to-bottom. All else equal, the principle of parsimony makes Poisson regression the winner.
Rounding Factors (Optional)
Before exiting, you will benefit by seeing how to set up an optimal custom design like the one you just analyzed—using rounding tools to make them more do-able. Rebuild it by selecting File, New Design and saying Yes to Use previous design info. Then press Next, Next and Finish to see the original design layout for the antiseptic experiment built to I-optimal specifications. Note that the greyed-out portion of the recipe sheet shows the ingredients that are fixed for the experiment. Including these make the formulating easy by providing all that will be needed to fill out the blend 100 percent.
Those of you who formulate blends may be taken aback by the precision of the component levels. No worries! Right click the first component column-header and select Round Components.

Then select 1 for the Significant Digits and press OK. After reading the Warning that provides an alert to the issues of mixture constraints, again press OK. Now, as a practical matter, all the component levels can be achieved.

If you or your statistician have any concerns about the impact of rounding on optimality, put Stat-Ease’s superb design evaluation tools to good use.
Conclusion
As demonstrated by this tutorial, Poisson regression provides an advanced tool for modeling counts. It generally predicts results more accurately with greater precision than the ordinary least squares methods. Although many experimenters, particularly non-statisticians, might settle for the square root (or natural log) transformation for the sake of simplicity, it may be worth going to Poisson regression for counts. In the case of the antiseptic, Poisson regression came out ahead on all counts.