Stat-Ease Blog

Categories
10 highly intelligent features that make the most from every experiment
Stat-Ease software provides powerful tools for design of experiments (DOE) with a great deal of intelligence baked in. Here are 10 “smart” features that make DOE easy for our users. From bottom to top (ordered by DOE phase: design, modeling, optimization, and confirmation), every one of them provides great value.
Here we go—the countdown begins!
- Factorial design-building wizard guides you to right-sized experiments via a ‘heads-up’ on power to detect important effects despite the variability of run, sample, and test.
- Optimal design builder’s exchange algorithm delivers a finely crafted experiment customized per your specifications.
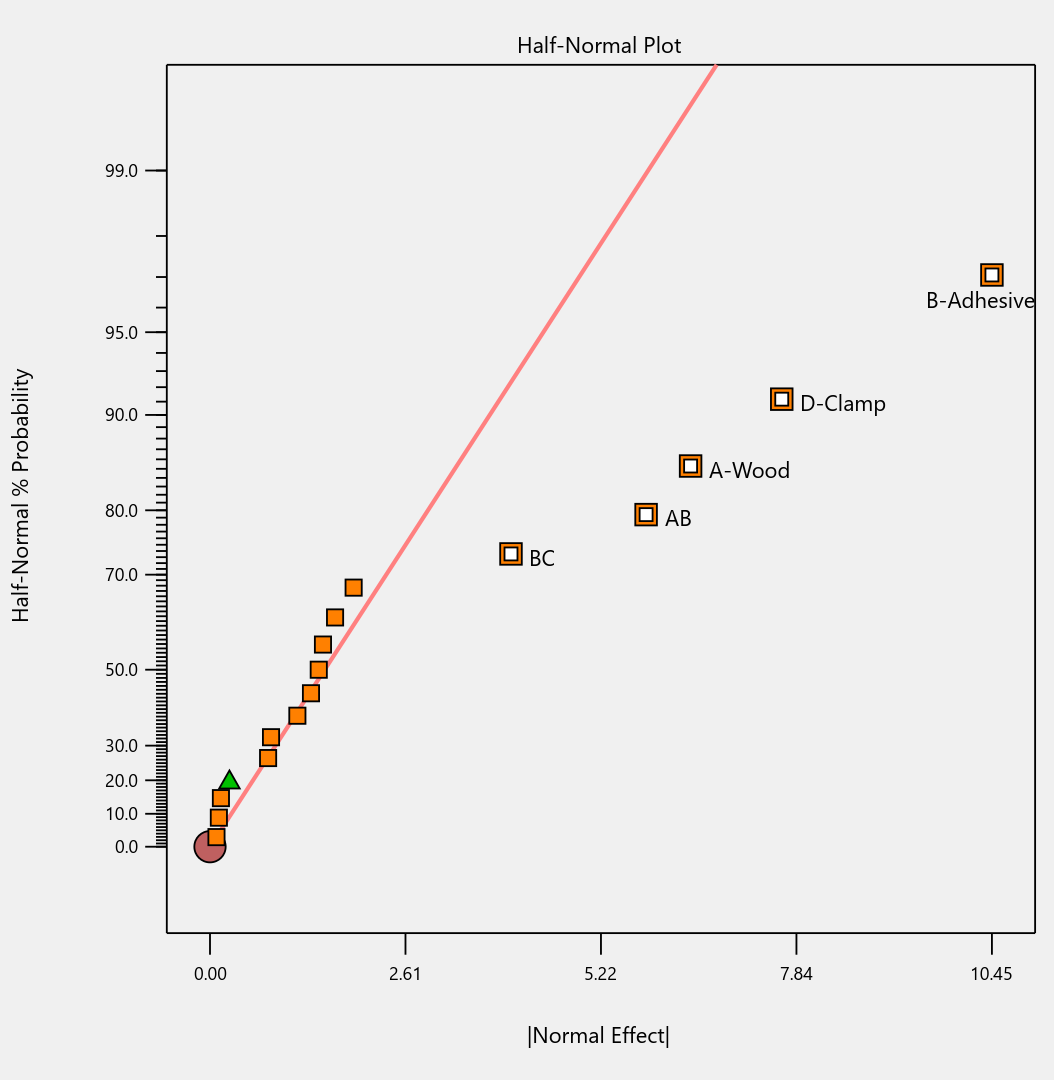
- Preset lineup of near-zero effects on the half-normal graph of factorial effects makes it easy to see those that merit selection.
- Scoring system for polynomial models suggests just the right 'Goldilocks' level that does not underfit or overfit your results.
- Box-Cox plot studies your model residuals and recommends whether or not to apply a transformation for a better fit and advises which one will do best.
- Detection of non-hierarchical models and, if you agree to fix this, the needed terms get added back for a well-formulated polynomial.
- Application of a curvature test to two-level factorial designs with center points with advice on how to augment the design if significant.
- Annotations on statistical outputs that explain them in plain English and provide advice on what to do when they go awry.
- Numerical search using a highly effective variable-size simplex algorithm finds the most desirable combination of factor settings and/or component levels meeting all your goals for process efficiency, product efficacy, and cost reduction.
- Confirmation tool smartly updates the prediction interval based on the number of follow-up runs at your chosen setting.
Finally, one bonus feature in Stat-Ease software that will make you more intelligent: screen tips via the lightbulb icon (click the >> chevron if showing) next to the Help bubble. This will show interesting information about each feature on the screen for you to understand the underlying statistics.
Email me your favorite “they thought of everything” quality aspect of Stat-Ease software, and I will add it to my list for my next ‘shout out’ on intelligent features.
Are optimal response surface method (RSM) designs always the optimal choice?
Most people who have been exposed to design of experiment (DOE) concepts have probably heard of factorial designs—designs that target the discovery of factor and interaction effects on their process. But factorial designs are hardly the only tool in the shed. And oftentimes to properly optimize our system a more advanced response surface design (RSM) will prove to be beneficial, or even essential.
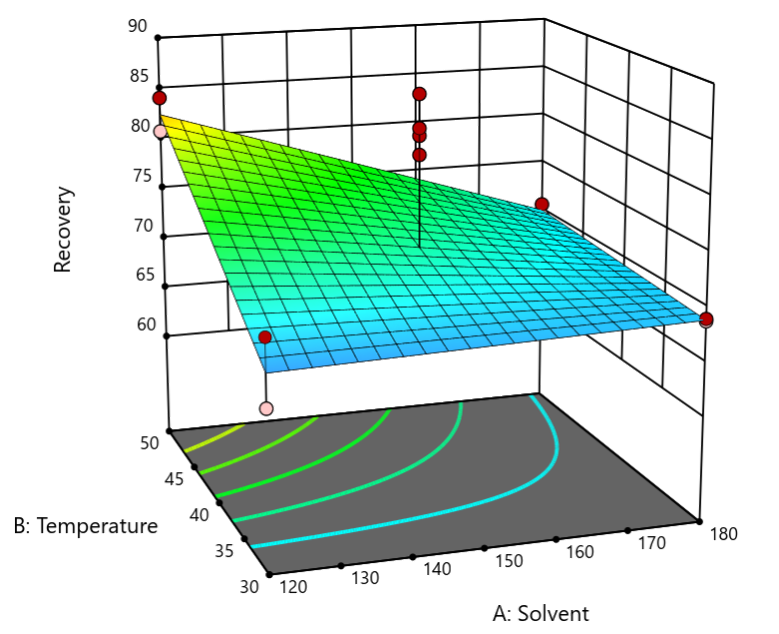
This is the case when there is “curvature” within the design space, suggesting that quadratic (or higher) order terms are needed to make valid predictions between the extreme high/low process factor settings. This gives us the opportunity to find optimal solutions that reside in the interior of the design space. If you include center points in a factorial design, you can check for non-linear behavior within the design space to see if an RSM design would be useful (1). But which RSM options should you pick?
Let’s start by introducing the Stat-Ease® software menu options for RSM designs. Once we understand the alternatives we can better understand when which might be most useful for any given situation and why optimal designs are great—when needed.
- First on the list is the central composite design (our software default)
- Next is the Box-Behnken design
- And third is something called optimal design
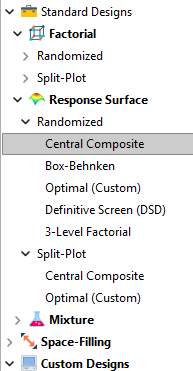
Stat-Ease software design selection options
The natural question that often pops up is this. Since optimal designs are third on our list, are we defaulting to suboptimal designs? Let’s dig in a bit deeper.
The central composite design (“CCD”) has traditionally been the workhorse of response surface methods. It has a predictable structure (5 levels for each factor). It is robust to some variations in the actual factor settings, meaning that you will still get decent quadratic model fits even if the axial runs have to be tweaked to achieve some practical values, including the extreme case when the axial points are placed at the face of the factorial “cube” making the design a 3-level study. A CCD is the design of choice when it fits the problem and generally creates predictive models that are effective throughout the design space--the factorial region of the design. Note that the quadratic predictive models generally improve when the axial points reside outside the face of the factorial cube.
When a 5-level study is not practical, for example, if we are looking at catalyst levels and the lower axial point would be zero or a negative number, we may be forced to bring the axial points to the face of the factorial cube. When this happens, Box-Behnken designs would be another standard design to consider. It is a 3-level design that is laid out slightly differently than a CCD. In general, the Box-Behnken results in a design with marginally fewer runs and is generally capable of creating very useful quadratic predictive models.
These standard designs are very effective when our experiments can be performed precisely as scripted by the design template. But this is not always the case, and when it is not we will need to apply a more novel approach to create a customized DOE.
Optimal designs are “custom” creations that come in a variety of alphabet-soup flavors—I, D, A, G, etc. The idea with optimal designs is that given your design needs and run-budget, the optimization algorithm will seek out the best choice of runs to provide you with a useful predictive model that is as effective as possible. Use of the system defaults when creating optimal designs is highly advised. Custom optimal designs often have fewer runs than the central composite option. Because they are generated by a computer algorithm, the number of levels per factor and the positioning of the points in the design space may be unique each time the design is built. This may make newcomers to optimal designs a bit uneasy. But, optimal designs fill the gap when:
- The design space is not “cuboidal”— there are constraints on the operating region that make the design space lopsided or truncated.
- There are categoric or discrete numeric factors to deal with.
- The expected polynomial model is something other than a full quadratic.
- You are trying to augment an existing design to expand the design space or to upgrade to a higher order model.
The classic designs provide simple and robust solutions and should always be considered first when planning an experiment. However, when these designs don’t work well because of budget or practical design space constraints, don’t be afraid to go “outside the box” and explore your other options. The goal is to choose a design that fits the problem!
Acknowledgement: This post is an update of an article by Shari Kraber on “Modern Alternatives to Traditional Designs Modern Alternatives to Traditional Designs" published in the April 2011 STATeaser.
(1) See Shari Kraber’s blog post, “"Energize Two-Level Factorials - Add Center Points!” from August. 23, 2018 for additional insights.
Like the blog? Never miss a post - sign up for our blog post mailing list.