
Stat-Ease Blog

Categories
Don’t Waste Existing Data: Import it and Mine for Gold
Existing data can yield valuable insights for immediate process or product improvement or point you in the right direction for a well-planned experiment. Here’s how to get that “happenstance” data into Stat-Ease software in a few clicks and put its powerful modeling, graphing and optimization tools to good use.
Original question from a pharmaceutics professor:
“I am trying to make the most from existing data on a sustained-release formulation based on happenstance inputs. We have all the corresponding responses. How can I import this data into your software?“
Answer from Stat-Ease:
Design-Expert® software (DX) provides handy and intuitive import tools to paste in existing data copied to the Windows clipboard, ideally from Excel. Stat-Ease® 360 (SE360) software offers additional capability to read Excel files for direct import. This tool can be accessed from the main screen.
I will now demonstrate importing via pasting data from your clipboard, doable with either DX or SE360.
Begin by copying data on all your inputs—process factors and/or mixture components—and outputs (the responses), including the names and units of measure, to the clipboard.
Next open your Stat-Ease software, click IMPORT DATA and then Paste from Clipboard as shown in Figure 1.
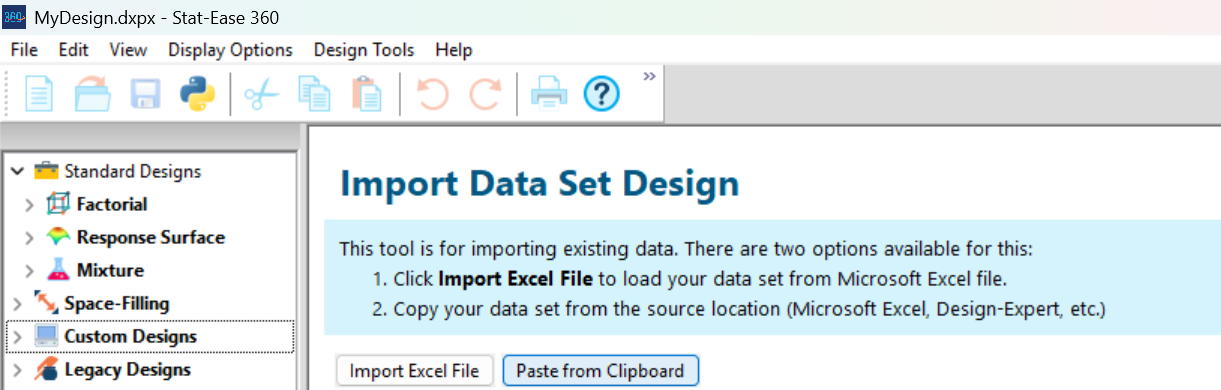
Figure 1: Preparing to paste in existing data
Then, via right clicks on rows and columns, identify or delete them. You will find this process to be very easy and intuitive.
For example, I imported a dataset from the U.S. Bureau of Labor Statistics that James Longley used to test regression software.* Next, as displayed in Figure 2, I began the process of identification by right clicking to the left of row 1 and making it the factor names.
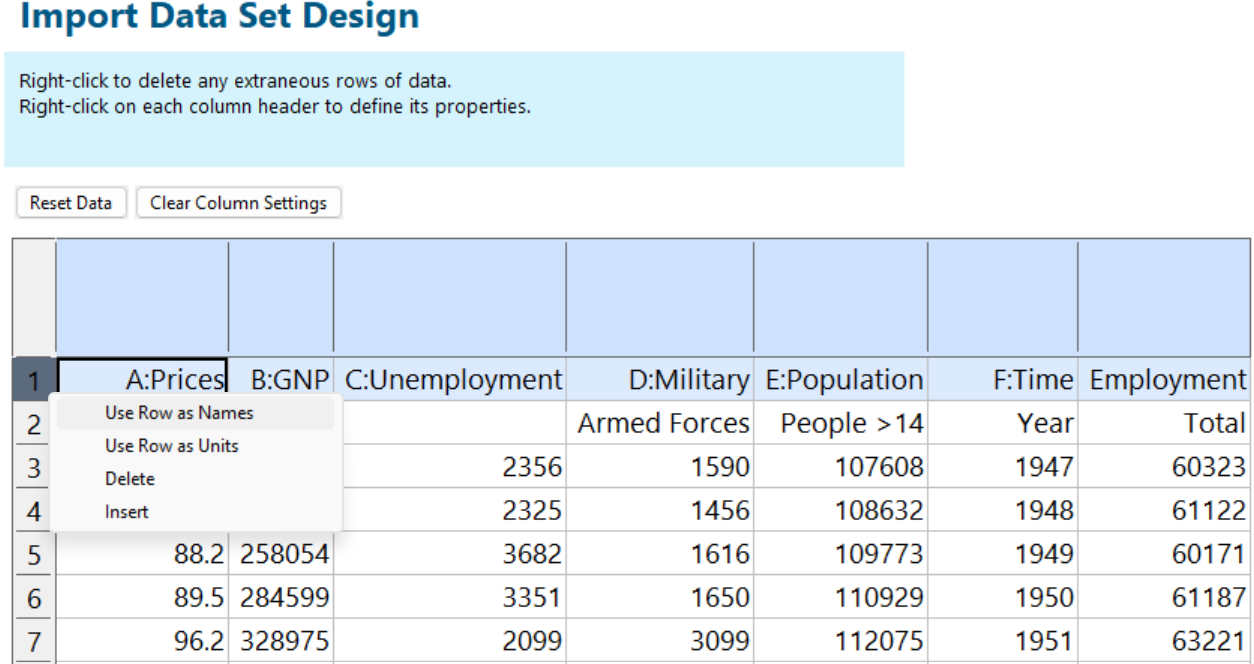
Figure 2: Identifying the first row of pasted-in Longley data as the factor names
After identifying the second row as units, I right clicked on the first column and set it as a numeric factor as shown in Figure 3.
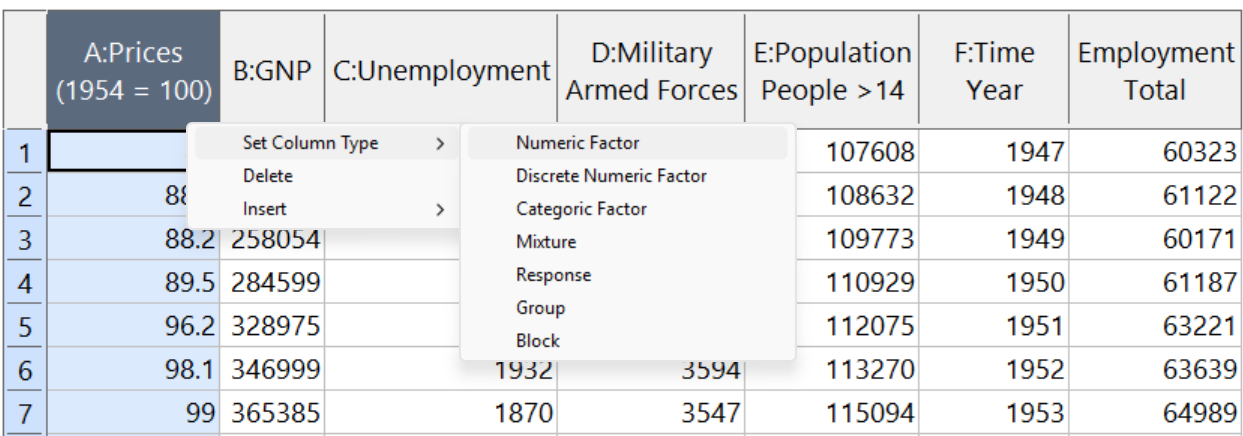
Figure 3: Identifying the first column as a numeric factor
From there I identified the other factors and the response. When all rows and columns were identified, I pressed Finish.
Stat-Ease software provides many helpful guard rails and niceties throughout the entire process of importing data and helping you model it. For example, if you forget to identify a row or column, the software will pop up an error. Also, it provides special treatment to inputs identified as mixture components—ensuring that they always add to a fixed total. After accomplishing the import, Stat-Ease software sets up the appropriate analysis—factorial, process response surface, mixture or combined mixture-process.
For a video demo of the process to import the Longley data, view my presentation on Evaluating and Exploiting Existing Data (gold or garbage?). As you will see, it is very easy to do. The video shows how Stat-Ease software’s powerful tools can then be deployed to mine the most from your existing data, making it easy to deploy regression tools to derive predictive models, generate compelling 3D and other graphics and search out desirable settings for the factors and/or components.
*“An Appraisal of Least Squares Programs for the Electronic Computer from the Point of View of the User,” Journal of the American Statistical Association, 62 (1967): 819-841.
Putting a Cap on Encaps: Taming Percentage Data with the Logit Transformation
When your designed experiments succeed a little too well, predicted percentages can creep past 100%, which is great for morale but terrible for credibility. A pharmaceutical research scientist ran into exactly this problem when fitting results for an encapsulation and asked Stat-Ease for a fix. The answer, courtesy of a chemical engineer's hard-won process development experience, involves one clever transformation and a rename button used with purpose.
Original question from a pharmaceutical research scientist:
"We usually report encapsulations (“Encaps”) in percentages. Is there a way to tell Stat-Ease software that Encaps cannot exceed 100%?"
Answer from Stat-Ease Consultant, Mark Anderson:
I came across this issue many times in my career as a chemical engineer doing process development aimed at maximizing yields. When my designed experiments succeed by pushing them up to near 100%, the confidence intervals on predicted results would range above 100%. This undermined credibility. Fortunately, Stat-Ease software provides a response transformation, called a “logit” (a combination of “logistic” and "digit,” pronounced “loh jit”), that prevents this from happening.
To apply this transformation, via the + key, add a new model for Encaps. Then select Logit and enter 0 and 100 for the lower and upper bounds, respectively.
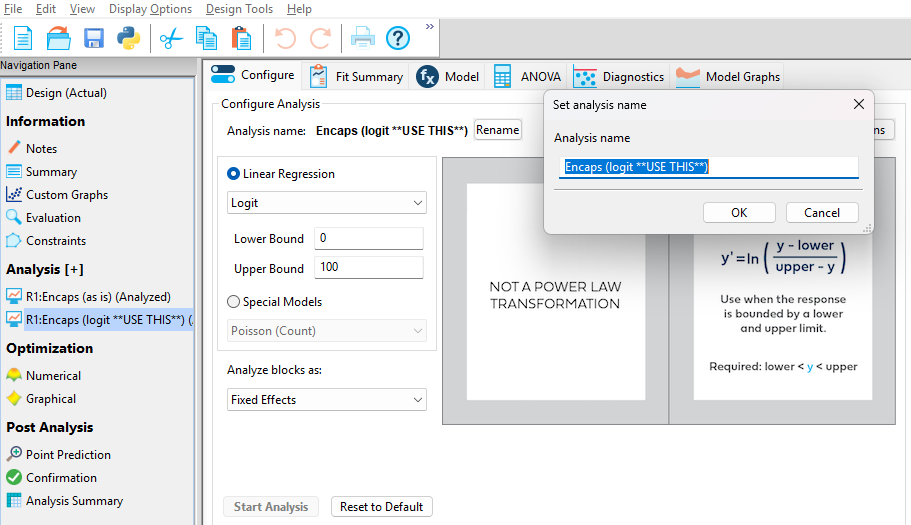
Adding a new model with the logit transformation applied
Then click the Rename button to identify that this new analysis is in the logit scale. If transformations like this prove to be effective (as it did in your case, per your follow-up report), I advise a further renaming to say “**USE THIS**” or something along these lines, thus making it clear which model to apply when doing subsequent numerical optimization.
PS: For details on logit and other transformations, as well as special models, see this Help topic.
The Peculiar Math Behind Mixture Experiments: A Sugar-Sweetness Case Study
Ever run a mixture experiment where every component looks like a win, only to have the trace plot tell a different story? The following FAQ tackles that exact puzzle — why some ingredients can show a “negative” track in a trace plot even when they contribute positively overall. Stat-Ease consultant Mark Anderson breaks down the mixture-model math behind it using a simple sugar-sweetness example.
Original question from a chemist:
“I completed a mixture screening experiment to assess the effects of 3 components. All ingredients produced positive effects. However, the trace plot contradicts this outcome—several of the components (A, B and C) displaying negative tracks. How can this be?”
Answer from Stat-Ease:
“This is a peculiarity of the mixture models (also known as Scheffé polynomials). I created a similar example on a hypothetical mixture of 3 types of sugar by setting up an equation-only model: R = 1A + 2B + 3C. Then I generated a trace plot showing how the predicted response changes when you increase one component while keeping the ratios of the other components constant.
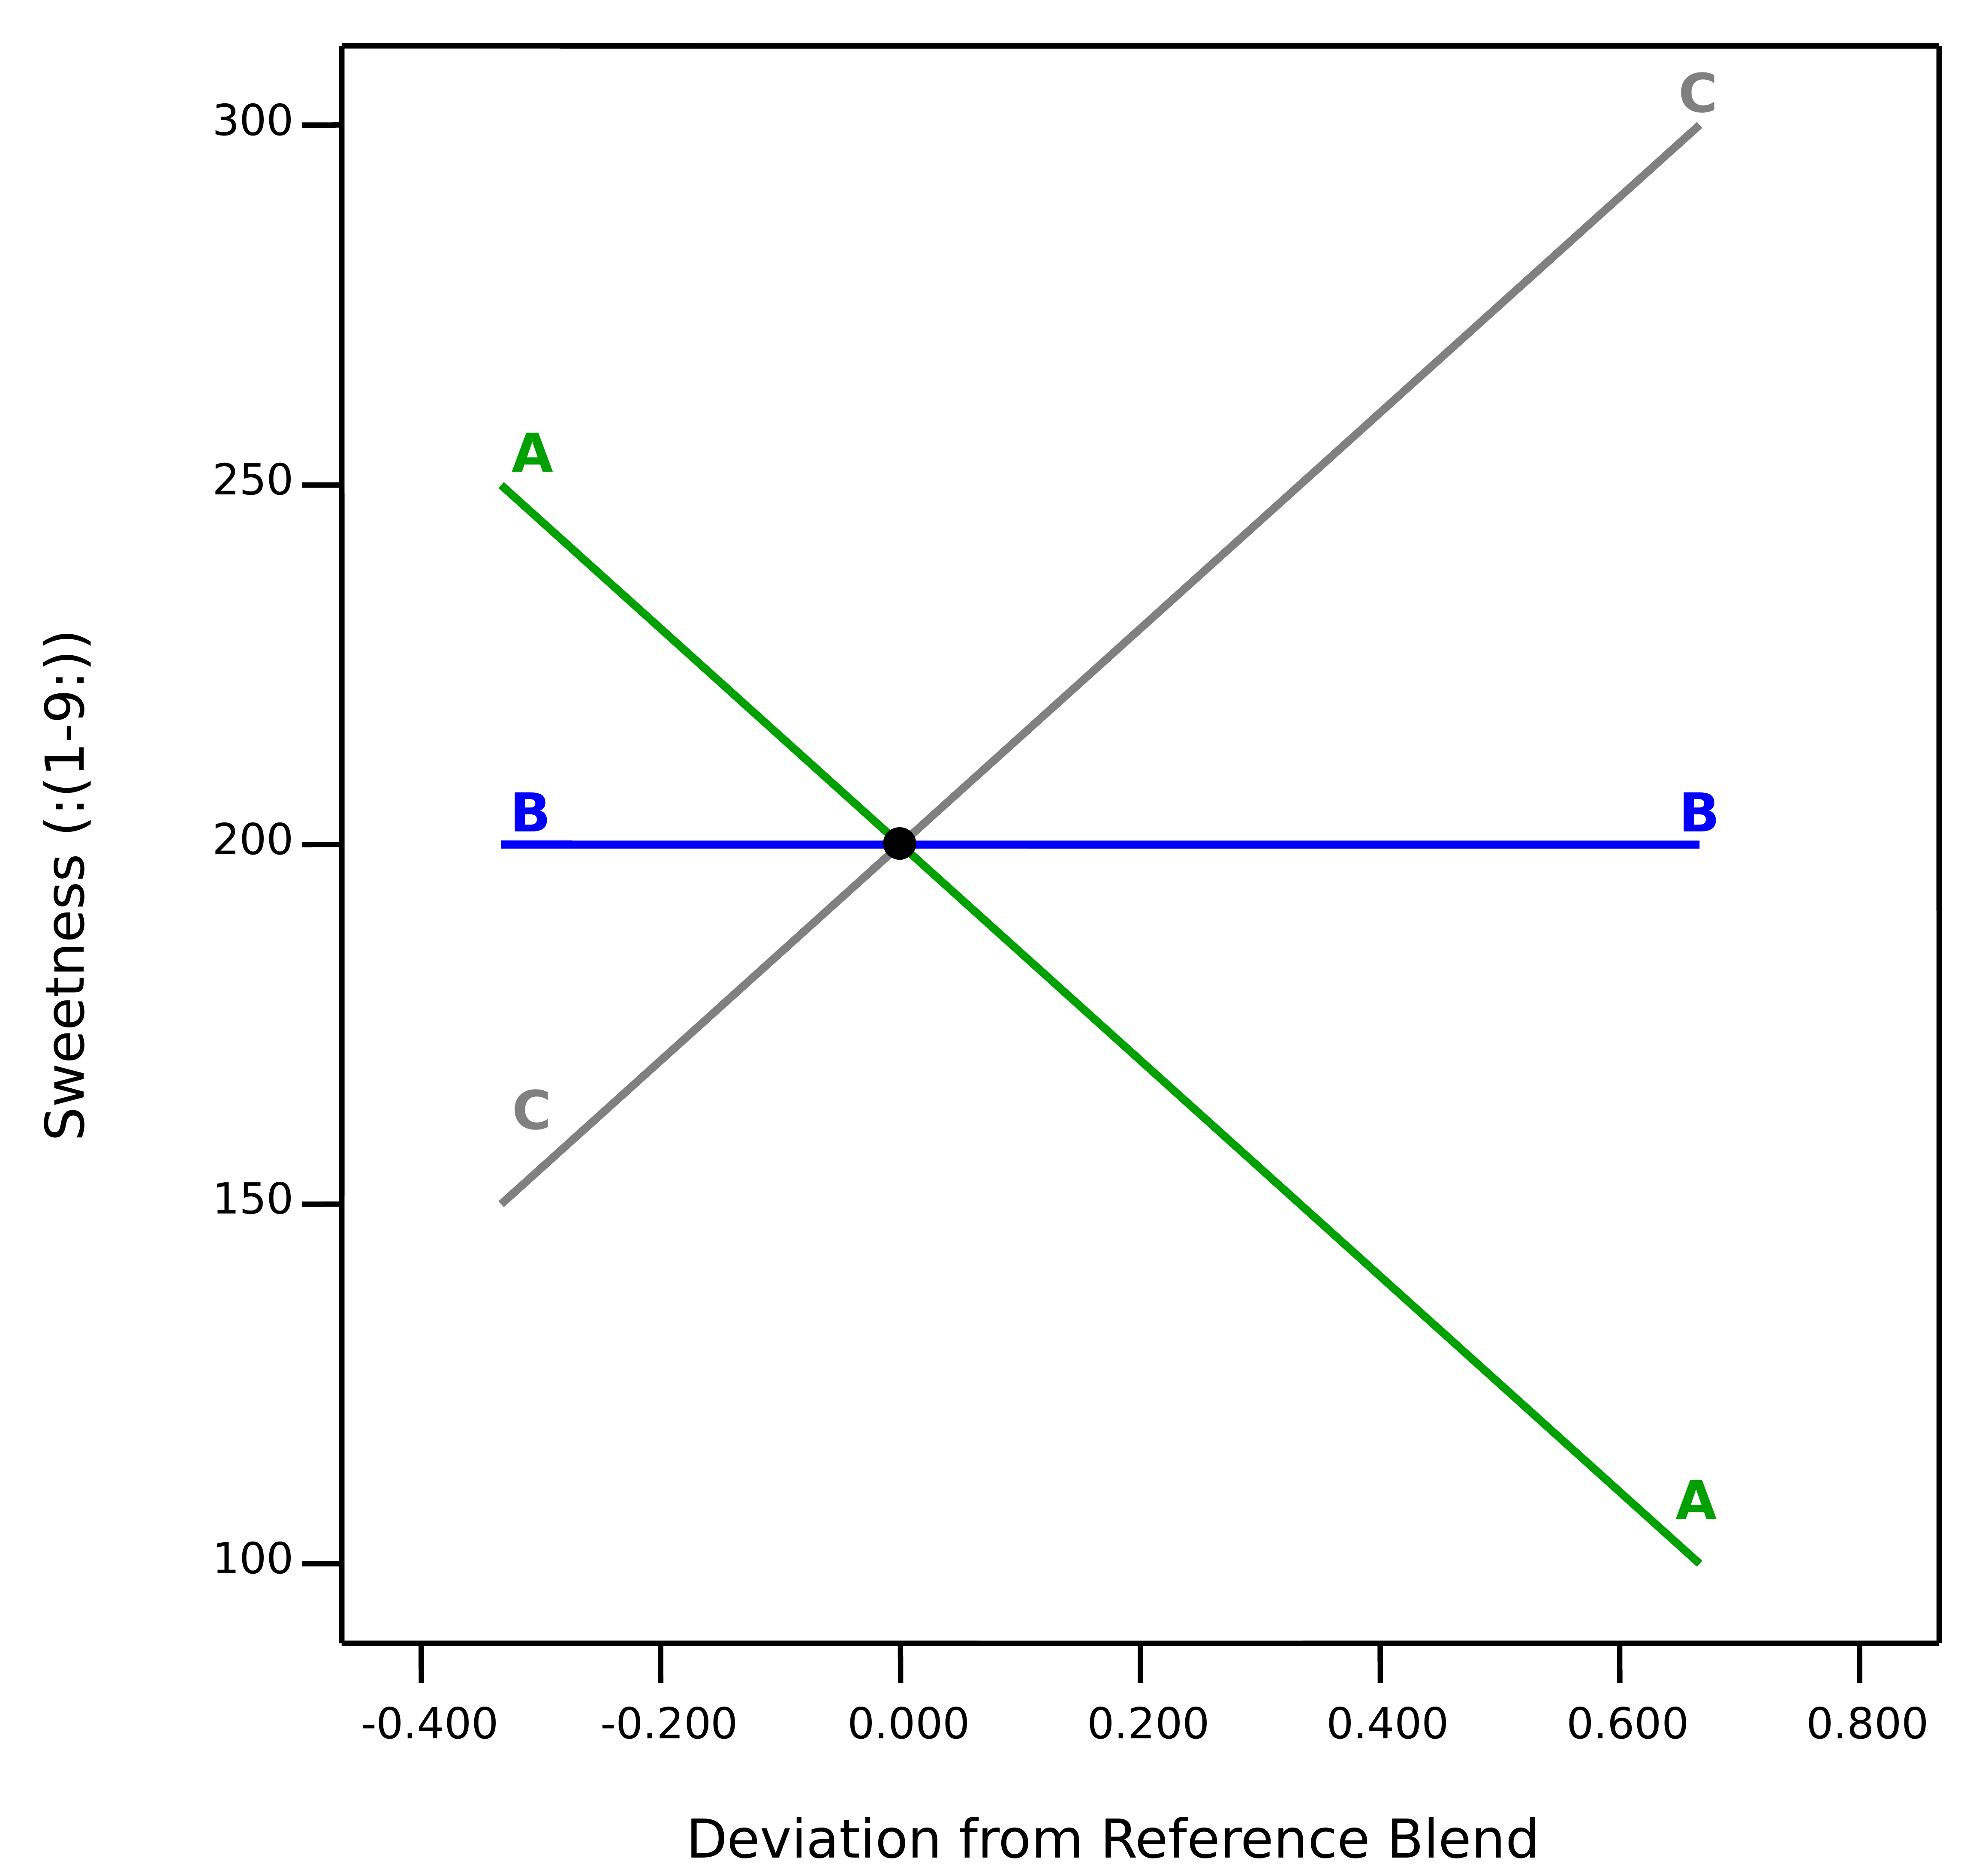
Trace plot from mixture screening experiment
The plot shows the downward impact of A (sugar S1) on sweetness due to it having the lowest coefficient of the three ingredients. This is relative to the other ingredients, adding more of that specific component does not lower the response on its own. Component B (sugar S2) generates a flat track—it’s impact on sweetness is ‘middling.’ The most impactful ingredient is C (sugar S3), as evidenced by its upward track.
For another example showing the trace plot being put to good use, see the November 2024 blog Perfecting pound cake via mixture design for optimal formulation.
Ask An Expert: Len Rubinstein
Next in our 40th anniversary “Ask an Expert” blog series is Leonard “Len” Rubinstein, a Distinguished Scientist at Merck. He has over 3 decades of experience in the pharmaceutical industry, with a background in immunology. Len has spent the last couple of decades working on bioanalytical development, supporting bioprocess and clinical assay endpoints. He’s also a decades-long proponent of design of experiments (DOE), so we reached out to learn what he has to say!
When did you first learn about DOE? What convinced you to try it?
I first learned about DOE in 1996. I enrolled in a six-day training course to better understand the benefits of this approach in my assay development.
What convinced you to stick with DOE, rather than going back to one-factor-at-a-time (OFAT) designs?
Once I started using the DOE approach, I was able to shorten development time but, more importantly, gained insights into understanding interactions and modeling the results to predict optimal parameters that provided the most robust and least variable bioanalytical methods. Afterward, I could never go back to OFAT!
How do you currently use & promote DOE at your company?
DOE has been used in many areas across the company for years, but it has not been explicitly used for the analytical methods supporting clinical studies. I raised awareness through presentations and some brief training sessions. Afterward, after my management adopted it, I started sponsoring the training. Since 2018, I have sponsored four in-person training sessions, each with 20 participants.
Some examples of where we used DOE can be found at the end of this interview.
What’s been your approach for spreading the word about how beneficial DOE is?
Convincing others to use DOE is about allowing them to experience the benefits and see how it’s more productive than using an OFAT approach. They get a better understanding of the boundaries of the levels of their factors to have little effect on the result and, more importantly, sometimes discard what they thought was an important factor(s) in favor of those that truly influenced their desired outcome.
Is there anything else you’d like to share to further the cause of DOE?
It would be beneficial if our scientists were exposed to DOE approaches in secondary education, be it a BA/BS, MA/MS, or PhD program. Having an introduction better prepares those who go on to develop the foundation and a desire to continue using the DOE approach and honing their skills with this type of statistical design in their method development.
And there you have it! We appreciate Len’s perspective and hope you’re able to follow in his footsteps for experimental success. If you’re a secondary education teacher and want to take Len’s advice about introducing DOE to your students, send us a note: we have “course-in-a-box” options for qualified instructors, and we offer discounts to all academics who want to use Stat-Ease software or learn DOE from us.
Len’s published research:
Whiteman, M.C., Bogardus, L., Giacone, D.G., Rubinstein, L.J., Antonello, J.M., Sun, D., Daijogo, S. and K.B. Gurney. 2018. Virus reduction neutralization test: A single-cell imaging high-throughput virus neutralization assay for Dengue. American Journal of Tropical Medicine and Hygiene. 99(6):1430-1439.
Sun, D., Hsu, A., Bogardus, L., Rubinstein, L.J., Antonello, J.M., Gurney, K.B., Whiteman, M.C. and S. Dellatore. 2021. Development and qualification of a fast, high-throughput and robust imaging-based neutralization assay for respiratory syncytial virus. Journal of Immunological Methods. 494:113054
Marchese, R.D., Puchalski, D., Miller, P., Antonello, J., Hammond, O., Green, T., Rubinstein, L.J., Caulfield, M.J. and D. Sikkema. 2009. Optimization and validation of a multiplex, electrochemiluminescence-based detection assay for the quantitation of immunoglobulin G serotype-specific anti-pneumococcal antibodies in human serum. Clinical and Vaccine Immunology. 16(3):387-396.
Ask An Expert: Shari Kraber
Welcome to the first entry in our 40th anniversary Ask An Expert series, where we talk to current and past power users of Design-Expert® and Stat-Ease® 360 software about their experience with design of experiments (DOE) and our software. For this post, we interviewed Shari Kraber, formerly the Client Success Manager, Workshop Manager, and Senior Instructor for Stat-Ease. Shari retired in 2022 after nearly 3 decades of helping clients across all industries learn DOE and implement it to save time & money making breakthrough improvements on their products & processes.
What’s the biggest benefit to educating your team about DOE?
You’ll break the habit of testing changes one at a time. Many systems will have unknown interactions, and only structured DOE test plans will reveal them. Your team will learn a new way of approaching problems, which helps the company in the long run.
You spent so many years helping folks change from one-factor-at-a-time testing to using DOE. What’s something about DOE that more people should know?
Remember that DOE is about trying to get a bunch of information from a small sample of a large process. The analysis does not need to be perfect in order to be useful. Don’t get paralysis by analysis – just find a simple and reasonable model and then CONFIRM the results. You should use software to design and plan the experiments – a good (robust) design will help offset the inevitable problems encountered while running the physical experiment, so that the analysis will be useful enough to make business decisions.
Your background is as a process engineer at 3M, but you always insisted that anyone working with formulations should use mixture designs. Why?
When the response is dependent on the proportions of the ingredients, then two things make this different from a process design:
- The design space changes to accommodate the proportions of the ingredients.
- The polynomial model is a different form (use a Scheffé polynomial) so that the nonlinear components of the system are modeled correctly. A traditional polynomial will NOT model this system correctly!!
So, what’s the best way to train your team on DOE?
I think distance learning is great. Stat-Ease started doing distance-learning training via Zoom during the COVID-19 pandemic, and it remains a popular choice for teams. The big advantage of distance learning is that the massive amount of information provided is more digestible in half-day segments. The in-person training is pretty intense and is not as ideal educationally. Yes, it is nice to have a live trainer, but honestly the retention of the materials is BETTER using distance learning.
Finally, what features of Stat-Ease software do you want more folks to know about?
I have quite a few recommendations!
First, there are several great editing features if you right-click on any graphs in the software:
- Edit axes
- Plant flags (then right-click on them to edit info)
- Graph Preferences to edit font sizes, colors, display options
And some more:
- Confirmation node – add the settings for the confirmation runs that you want to do and it provides the 95% interval that should contain the mean of those runs.
- You can change the layout options when you have multiple tabs or windows in your analysis. The green + allows you to add more graphs to the display, such as viewing 2 interaction graphs at once, or a contour and 3D plot at the same time.
- In the Analysis Summary, the Coefficients Table can be Transposed by right-clicking on the top left corner square. (Transpose is now available on all tables, but particularly helpful on this one.)
If you’re ready to train your team on DOE, check out our public training options or email us with your questions. Shari still teaches classes on a part-time basis, and our whole team would love to get you rolling with best practices for DOE.